The Email

March 2022 Analytics Snapshot
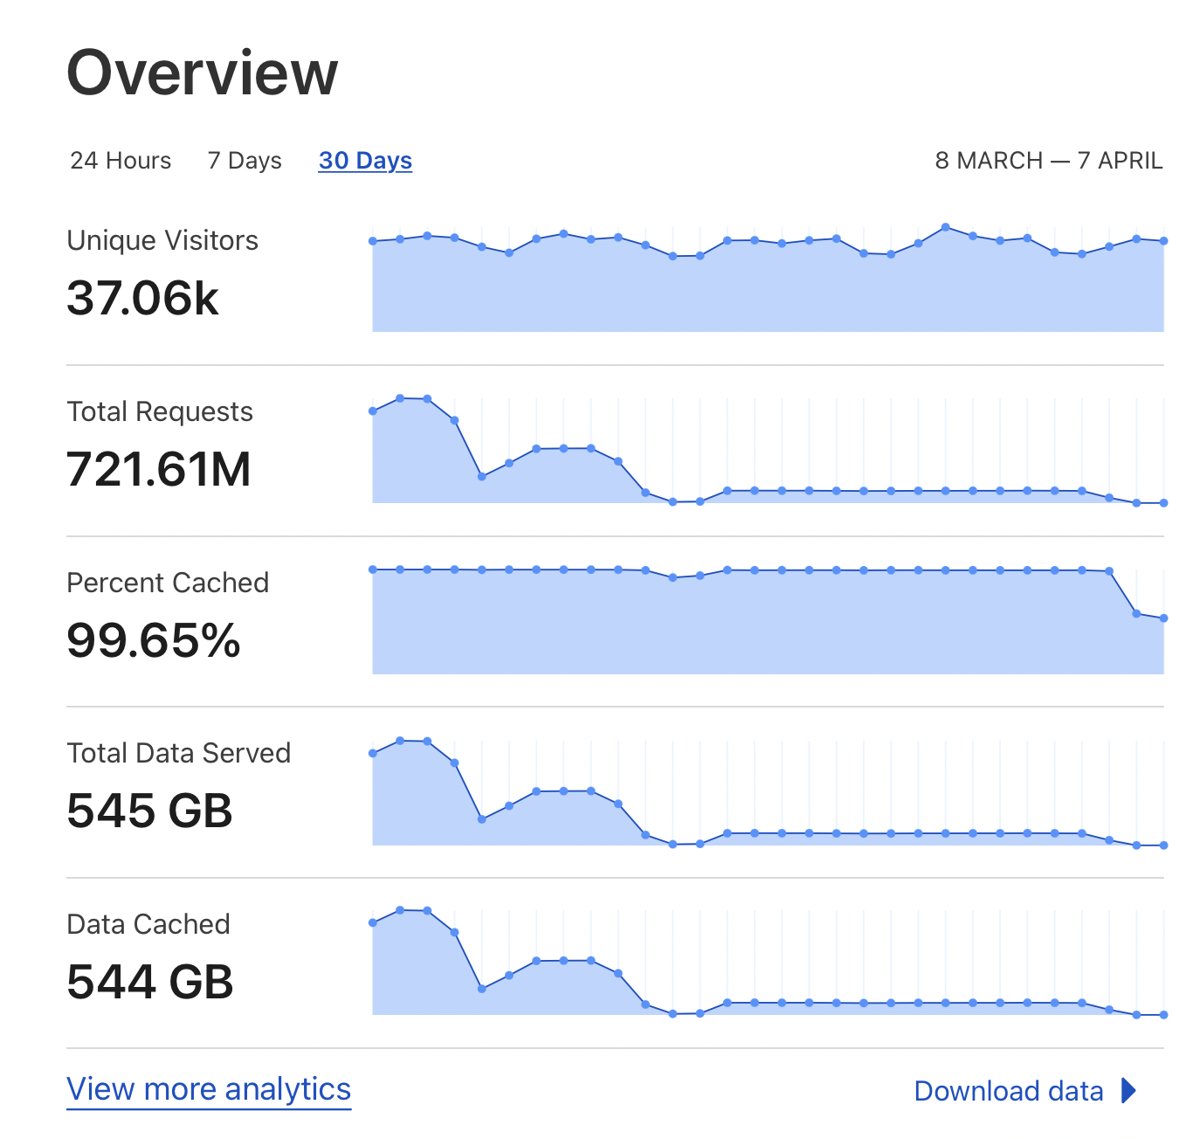
We’ve aggregated data from 26 of your Cloudflare sites during the month of March. Cloudflare served 788.57 GB of data, and mitigated 2.04k firewall events.
I was like “wow, that’s a lot more data than usu… wait, over a ¿BILLION REQUESTS FROM JAPAN!?!?!?
For comparison, February 2022’s stats had 183.7 GB of data and 214 million requests from Japan. Ok, that’s still a load of requests, but 4x as much is weird.
Also, A. BILLION. requests.
What’s changed?
I know what domain’s getting the traffic, but as for what’s changed about it - I’m honestly not sure. I surely haven’t done anything! In pondering the issue and writing this, I went back looking for what data I could find.
I keep all my emails because I’m like that, so I went back and grabbed a few stats emails. The domain was added to my Cloudflare account on 2020-11-28, and took a week or two for me to get running again to do the redirection thing… here’s the stats over time for my account (I don’t get domain-level stats, I can’t afford to pay for them!).
Most of the traffic typically has come to/from this blog or boryssnorc.com, a photos-laden travel blog.
| Month | Total Data | Requests (JP) | Requests (USA) | Requests (China) |
|---|---|---|---|---|
| July 2020 | 141.6 GB | Not listed | 333,588 | 16,127 |
| August 2020 | 138.37 GB | Not listed | 207,701 | Not listed |
| December 2020 | 14 GB | Not listed | 187,179 | Not listed |
| December 2021 | 22.85 GB | Not listed | 1,222,551 | 3,531,231 |
| January 2022 | 64.49 GB | 56,851,426 | 1,640,193 | 986,683 |
| February 2022 | 183.7 GB | 214,536,904 | 1,015,310 | 1,033,670 |
| March 2022 | 788.57 GB | 1,018,691,300 | 1,049,801 | 1,137,785 |
In July/August, the top source of data was Australia, because… reasons?
Of course, because I didn’t think to look while the data was available in the UI, the good bit’s cut off!
The view from Cloudflare
The domain
Oh, the domain? It’s melbourneitmirror.net. Melbourne IT was one of the first big registrars/hosting companies in Australia and they had a need for a local mirror, so they also made it publicly available.
I inherited the domain while at my previous job, when they were going to terminate the hosting and just let the domain lapse because ~8TB of fast disk is a lot to keep running.
I didn’t have the space/bandwidth to support a full mirror, and there was loads of traffic still going there, so I set up a little Flask app that returns HTTP 301 (Moved Permanently) responses to other mirrors. That should work for any sensible client, but … I guess it’s not for some! There’s always been a lot of requests, most of which I rate-limited by dropping (or trying to send other HTTP status codes) but they just. keep. coming. back.
Splunking the data
Of course I want to use Splunk to analyse the data, so I spun up some Python scripting to pull it. It’s in yaleman/cloudflare-stats if you’re interested.
tl;dr query all the zones, then query the GraphQL endpoint for analytics - do it every ~24 hours because that’s all I get, if I want hourly stats.
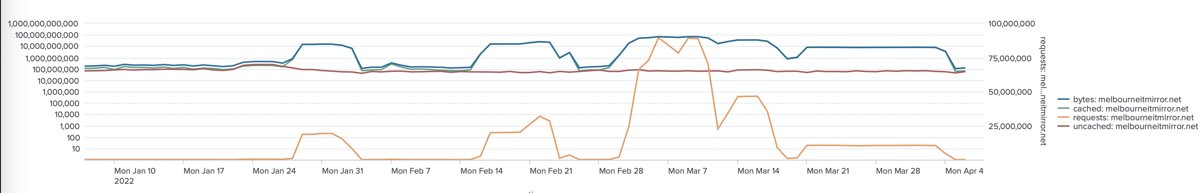
It was a pretty chill start to the year, and then… March got spicy!
Daily stats, Bytes and Requests
Thankfully, most of the requests are cached on Cloudflare’s network! Only about 10-100MB a day is actually served from my web server via the Cloudflare Tunnel, not exposing my server to the internet directly!
Here’s a sample, normally the cache percentages are lower because people ask for a lot of random file paths…
| Date | Requests | Bytes (total) | Cached Bytes | Bytes per Request (avg) | Cached % |
|---|---|---|---|---|---|
| 2022-03-01 | 210,877 | 189,972,294 | 129,849,558 | 900.9 | 68.4 |
| 2022-03-02 | 2,006,433 | 1,533,911,022 | 1,473,816,661 | 764.5 | 96.1 |
| 2022-03-03 | 24,308,492 | 18,442,721,223 | 18,366,206,975 | 758.7 | 99.6 |
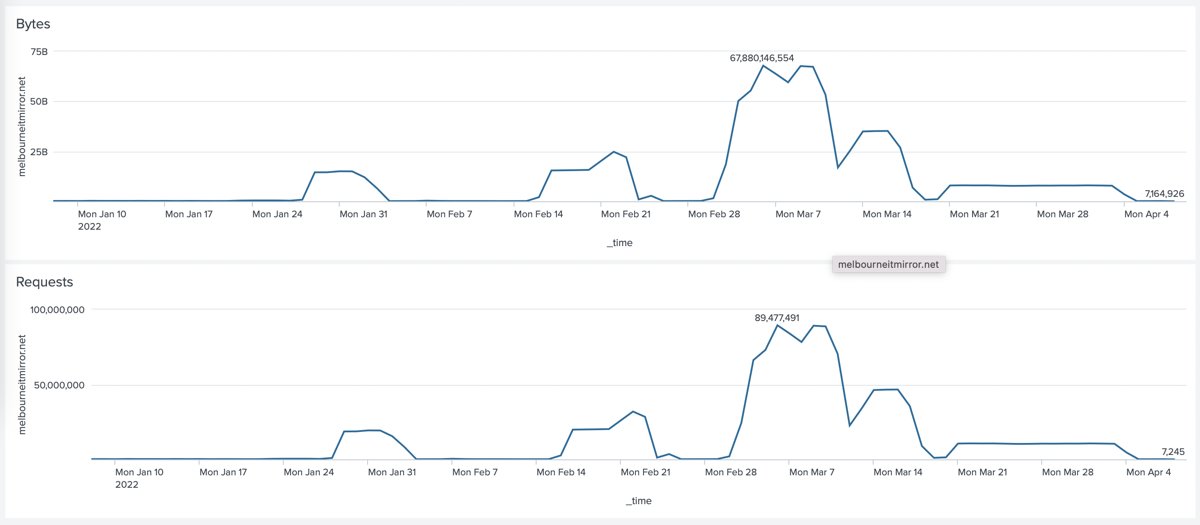
| 2022-03-06 | 89,477,491 | 67,880,146,554 | 67,812,834,089 | 758.6 | 99.9 |
| 2022-03-08 | 78,312,708 | 59,538,858,921 | 59,475,563,516 | 760.3 | 99.9 |
| 2022-03-09 | 89,187,377 | 67,671,616,289 | 67,604,187,924 | 758.8 | 99.9 |
| 2022-03-11 | 70,421,731 | 53,354,587,796 | 53,289,929,521 | 757.6 | 99.9 |
| 2022-03-12 | 22,613,190 | 16,931,149,088 | 16,863,985,370 | 748.7 | 99.6 |
| 2022-03-14 | 46,270,462 | 34,947,877,973 | 34,868,567,296 | 755.3 | 99.8 |
A peak of nearly 90 million requests on each of the 6th and 9th are pretty spectacular.
All in all, a bit of an achievement, I guess?
I’d really love to know what’s changed in Japan - did someone shut down some mirrors in early March?